Using TACE percentiles in animal selection


The TransTasman Angus Cattle Evaluation (TACE) routinely publishes estimated breeding values (EBV) percentile rankings for all animals in the TACE evaluation. The percentile value for each animal is displayed alongside the Estimated Breeding Values (EBV) and the Selection Index values on various platforms such as in the Angus Database search results, TACE herd reports and customised sale catalogues.
The percentile value describes where an Angus animal sits in the current TACE population for a specific EBV (i.e. genetics for a specific trait) or Selection Index (i.e. genetics for a specific production system). The current TACE population is specifically devised from the Angus animals that have a birth year two years older than the current analysis year. For example, for the 2023 evaluations, the 2021 drop Angus animals are set as the percentile benchmarking population. This will be updated to the 2022 drop animals for the 2024 evaluations. This ensures we are effectively benchmarking EBVs to a current (i.e modern) population of Angus animals.
An example of interpreting percentile values is if an animal’s 400 day weight EBV is +101kg, which is ranked in the 20th percentile (April 2023), effectively 80% of 2022 drop calves will have an EBV that is ranked lower than that individual. Similarly an animal with an Intramuscular Fat EBV of +1.0% ranks in the 80th percentile, with 80% of the 2022 drop calves with an EBV that ranks higher than that animal.
The TACE analysis supplies percentile results on all animals within the TACE analysis and displays these on a ranking from the top 1% of the breed ( 1st percentile) to the Bottom 1% of the breed ( 99th percentile). The use of percentiles has become an easy to interpret tool for cattle breeders to establish If the animal in question is more desirable or less desirable for specific breeding programs and objectives.
Percentiles are relevant to the population they are being compared against, meaning the published TACE percentiles are relevant only to cattle registered with Angus Australia and can not be compared across breed or within breed but across different breed societies i.e. Angus New Zealand. It is however important to note that the TACE analysis is a joint analysis of Angus Australia and Angus New Zealand resulting in the TACE EBVs being comparable, but the published percentiles are not comparable due to comparing to different benchmark populations.
A variation of this being the structural EBV analysis which is conducted by Angus Genetics Incorporated (AGI Inc), a subsidiary of the American Angus Association, from combined datasets from the Angus Australia, American Angus and Canadian Angus structural records. For this reason, Structural EBVs on animals registered with Angus New Zealand can not be compared to animals registered with Angus Australia. (i.e. completely separate and different analysis models)
For most other EBV traits, the direct EBV is comparable to establish expected progeny performance differences, however where the animal sits in reference to the rest of that population (its ranking) can be substantially different across the two societies.
For example, In the April 2023 TACE analysis the breed average for Angus Australia registered animals for 400 day weight is +90. The Angus New Zealand average is +76. This means an animal ranking in the 50th percentile (breed average) for 400 day weight registered with Angus Zealand, actually ranks in the 85th percentile of the breed when compared to those animals registered with Angus Australia that have the same EBV. The different average of populations can largely be put down to production system differences, environmental constraints coupled with the dedicated selection of certain traits over time by Angus cattle breeders.
Another example shows that the New Zealand Angus registered population has a higher Rib and Rump fat EBV indicating estimates of genetic differences between animals in fat depth at the 12/13th rib site and the P8 site in a 400 kg carcase. The Angus Zealand 2021 born calves EBV average is +1.1 for both traits, which puts those animals within the top 25th percentile for the Australian population.
Table 1 shows the different percentile rankings on a high use, high accuracy AI sire with calves registered in both countries.
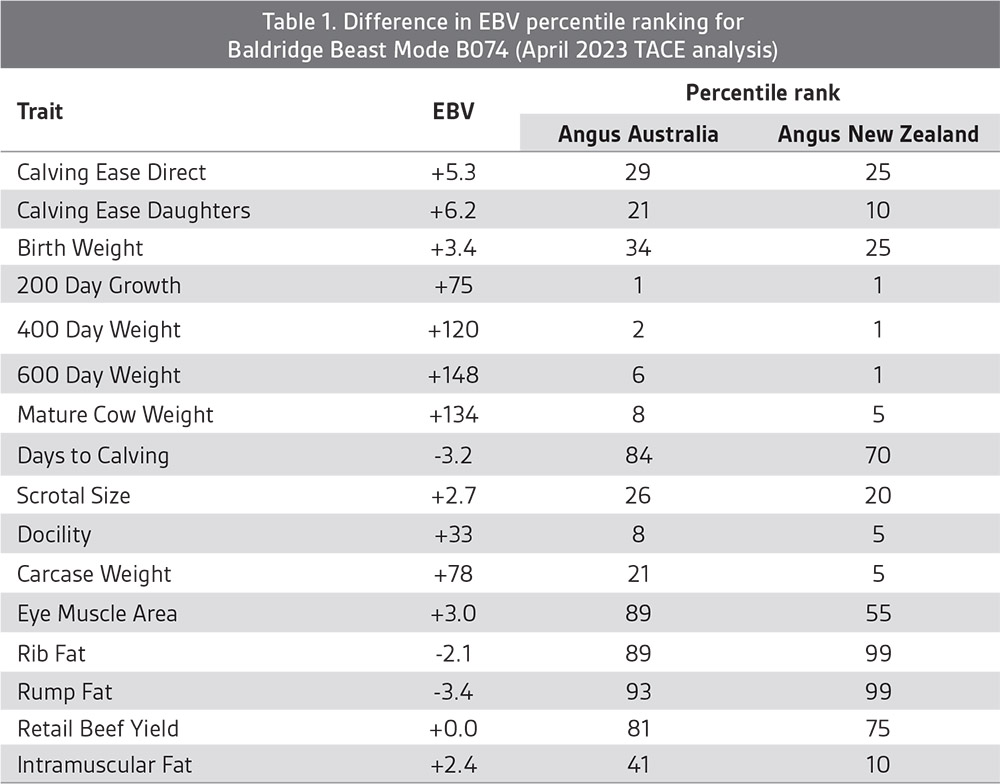
For Baldridge Beast Mode B074 (Table 1) the same set of EBVs applies to each country (i.e. TransTasman analysis), however the percentile ranking can be different for each EBV when compared to a population specific percentile.
An alternative way to view this is to compare the breed average or 50th percentile for both populations. Table 2 highlights the EBV differences between the 50th percentile for each population.
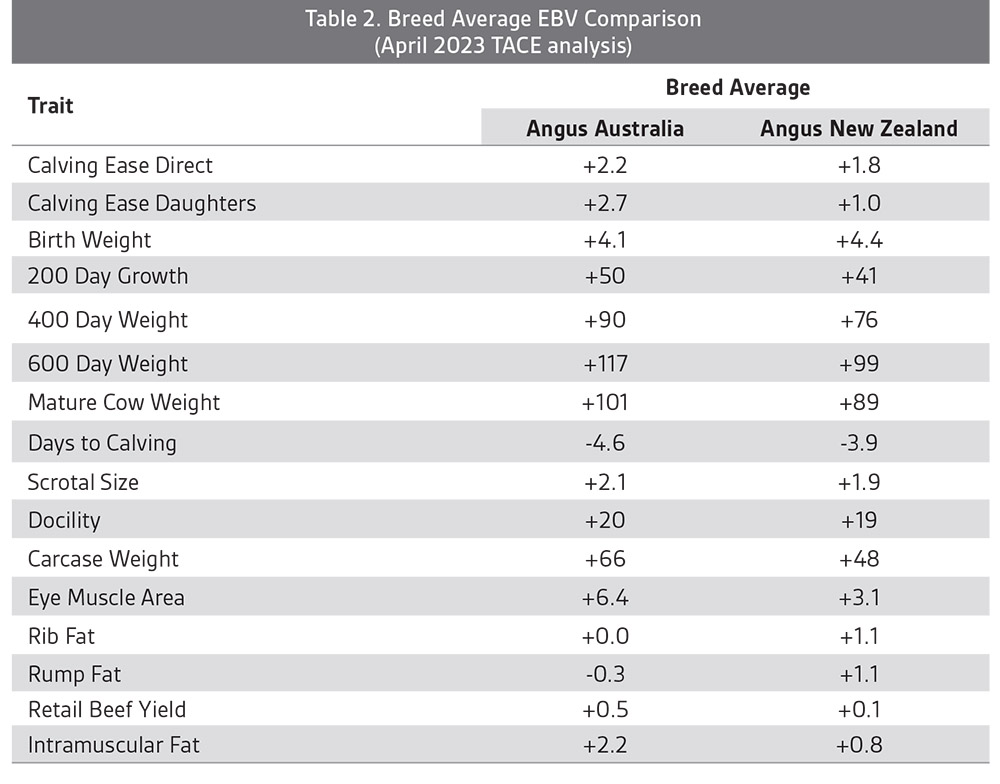
By simply accepting that the highest percentiles for each EBV indicates the most “desirable” is a flawed approach without understanding what each EBV is representing. An example of this is the Mature Cow Weight EBV, where the higher percentiles (e.g. top 1 %) is indicating heavier mature cows, which may not be aligned with the individual breeding objective of breeders trying to maintain Mature cow weight. Similarly, a Leg Angle EBV in the higher percentiles is indicating the animal is likely to contribute a Leg Angle score in progeny which is lower or closer to a score 5 ( i.e. straighter). Similar to Mature Cow Weight, selecting on higher percentile for this EBV may not align with a breeding objective in some situations.
Importantly the variation that exists in the EBV needs to be considered to make an informed selection decision and considering the percentile of the breeding candidates. For example, the difference between the 1st percentile and the 99th percentile for 400 day weight is +122kg to +57kg respectively. Assuming, all other things being equal, 50% of this difference is passed down to the progeny resulting in an expected average weight difference between the progeny of 32.5kg at 400 days. Another trait such as carcase Rib fat has the 1st percentile EBV at +4.2 and the 99th percentile at -4.1, resulting in an average difference observed in the progeny (based on a 400kg steer carcase) of approximately 4.2mm. Both of these traits and the variation represented are likely to have different economic importance for each cattle breeder.
A challenge for breeders is to balance the number of mating candidates that are available to meet their selection criteria , while also choosing to select cattle that rank high on EBV percentiles in their traits of importance. Generally an increased amount of selection pressure (i.e higher expectations) placed on the group of animals will ultimately also reduce the number of animals that meet the criteria. This should encourage breeders to identify their own traits of importance to focus on as they may be different to other operations.
An example of this occurring is by reviewing the 267 Angus semen sires (from April 2023) listed with Angus SemenSELECT on the Angus Australia website, with no individual animal ranking higher than breed average for every EBV, however more than 234 of these bulls have 5 traits or more considerably above breed average, further highlighting the need to have a defined breeding objective with established traits of importance.
With the addition of percentile graphs to database search results and various published EBV reports, breeders are able to quickly establish if a potential candidate suits their breeding requirements and warrants a further investigation without having to know the detail of a specific EBV or breed average EBV value.
The EBV Percentile Graphs can be utilised as a visual tool to understand the strengths and weaknesses of an individual animals genetic trait profile or as an average of a group of cattle in some circumstances. It can also be used to compare the attributes of different animals, and to identify which has the best combination of genetics for a given scenario.
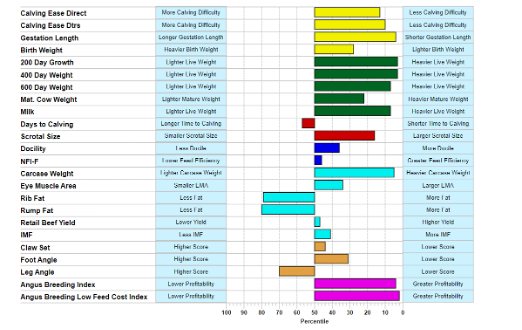
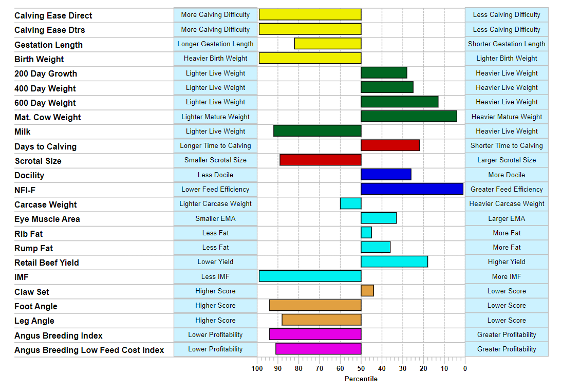
Consider the three bulls in Graph 1,2 &3, and their potential to be used as heifer bulls (i.e. joined to yearling heifers which will calve at 2 years of age). The biggest differences between the three bull examples are seen for the calving traits (Calving Ease Direct, Calving Ease Daughters, Gestation Length and Birth Weight) while maintaining some similarities in the weight traits (200 Day Weight, 400 Day Weight, 600 Day Weight and Mature Cow Weight). Bull 1 is a high growth bull, being in the 10th percentile (Top 10% of the breed) for 200, 400 & 600 day weight. This bull is also in the top 30% of the breed for calving ease traits, this is a major difference to bull 2 who is in the 80th percentile for calving ease traits (less desirable).
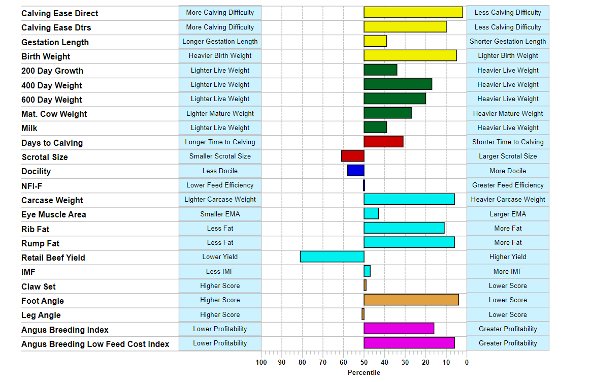
Another example shows the bull displayed in graph 3 having similar calving ease and growth EBV trait percentiles to that of bull 1 , however he is the only bull of the 3 examples to also have both rib fat and rump fat EBVs in the 20th percentile or higher.
– By Jake Phillips, Extension Manager