After some data preparation the analysis will start and display the following window which display the frontier and progeny trait distributions.
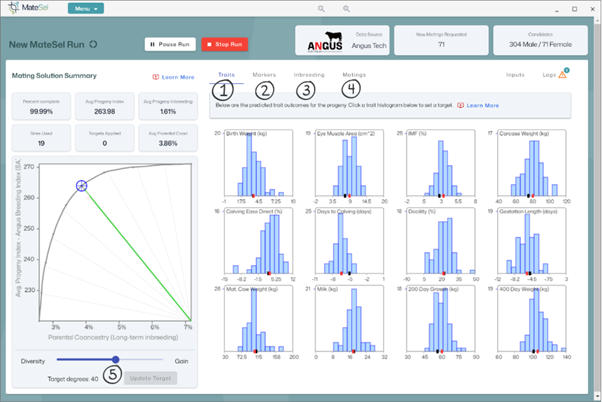
Dashboard results:
i. Percent Complete: Indicates the percentage of completion for the run. Criteria for stopping the run are set to 99%, however, if at any stage you are happy with the results, you can also select the “Stop Run” red button.
ii. Average Progeny Index: Displays the mean index value for the selection index originally selected in Step 5. “Defining a Breeding Objective (Basic Settings)”.
iii. Average Progeny Inbreeding: Displays the mean inbreeding coefficient of the progeny as a percentage value.
iv. Sire used: Displays the number of sires utilised from the list of candidates.
v. Targets applied: Displays the number of targets or criteria supplied to MateSel to refine the breeding objective.
vi. Average Parental Co-ancestry: Displays the mean level of co-ancestry between the selected parents from the candidate list.
Reviewing analysis results, to view select the corresponding tab.
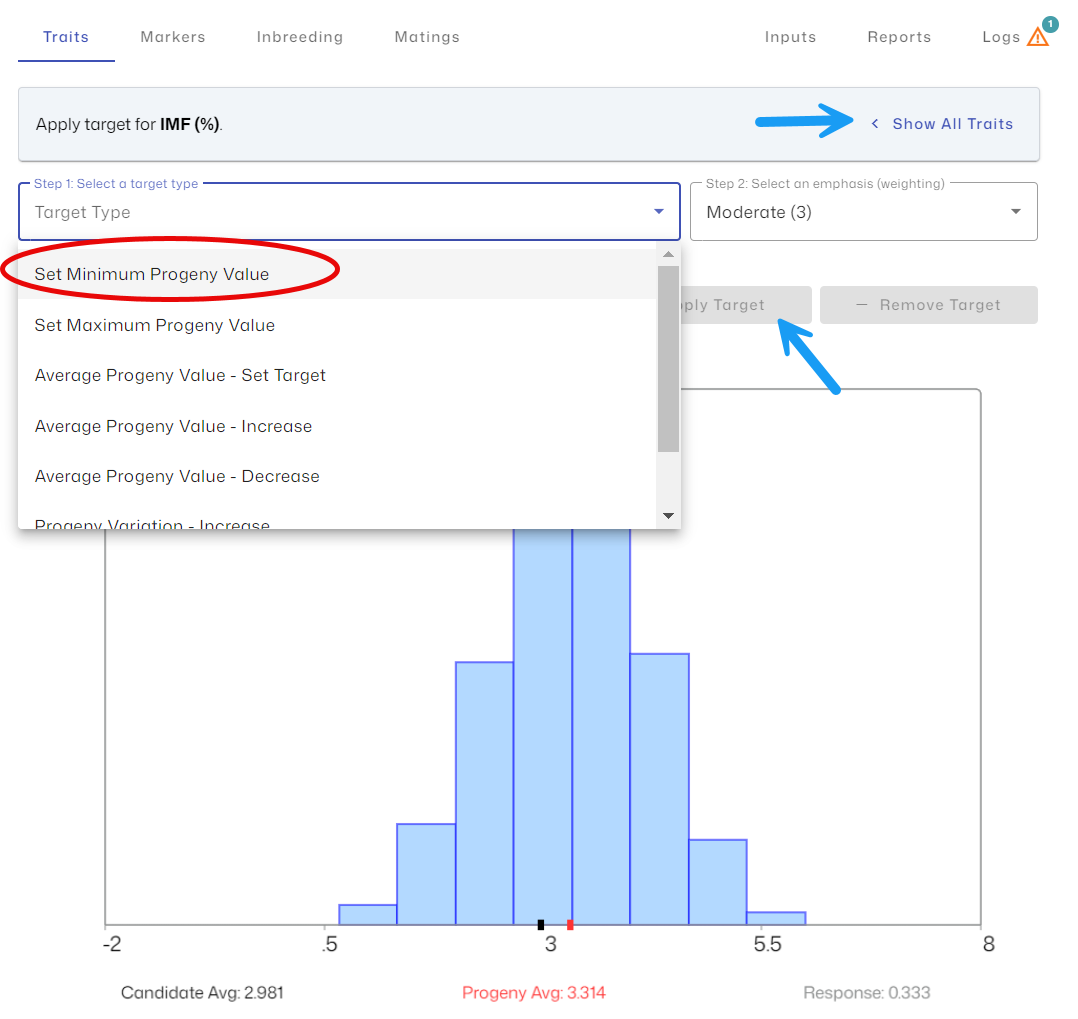
1. Traits – Displays the distribution of the EBVs of the resultant progeny for the 12 traits selected in step 5. “Defining the Breeding Objective (Basic Settings)”. The black marker indicates the progeny mean based on random mating, the red marker indicates the shift as a result of MateSel optimised mating selection.
(Note. These estimates are the expected mean of progeny and do not guarantee the EBV result of the resulting progeny).
Adding additional trait targets:
To add an additional target to one of the traits, select the corresponding histogram. Then choose the Target Type (e.g. minimum, maximum or average progeny values) and the emphasis (weighting). To apply the new target, select “Apply target”.
To return to the view with all 12 traits, select “Show all Traits”.
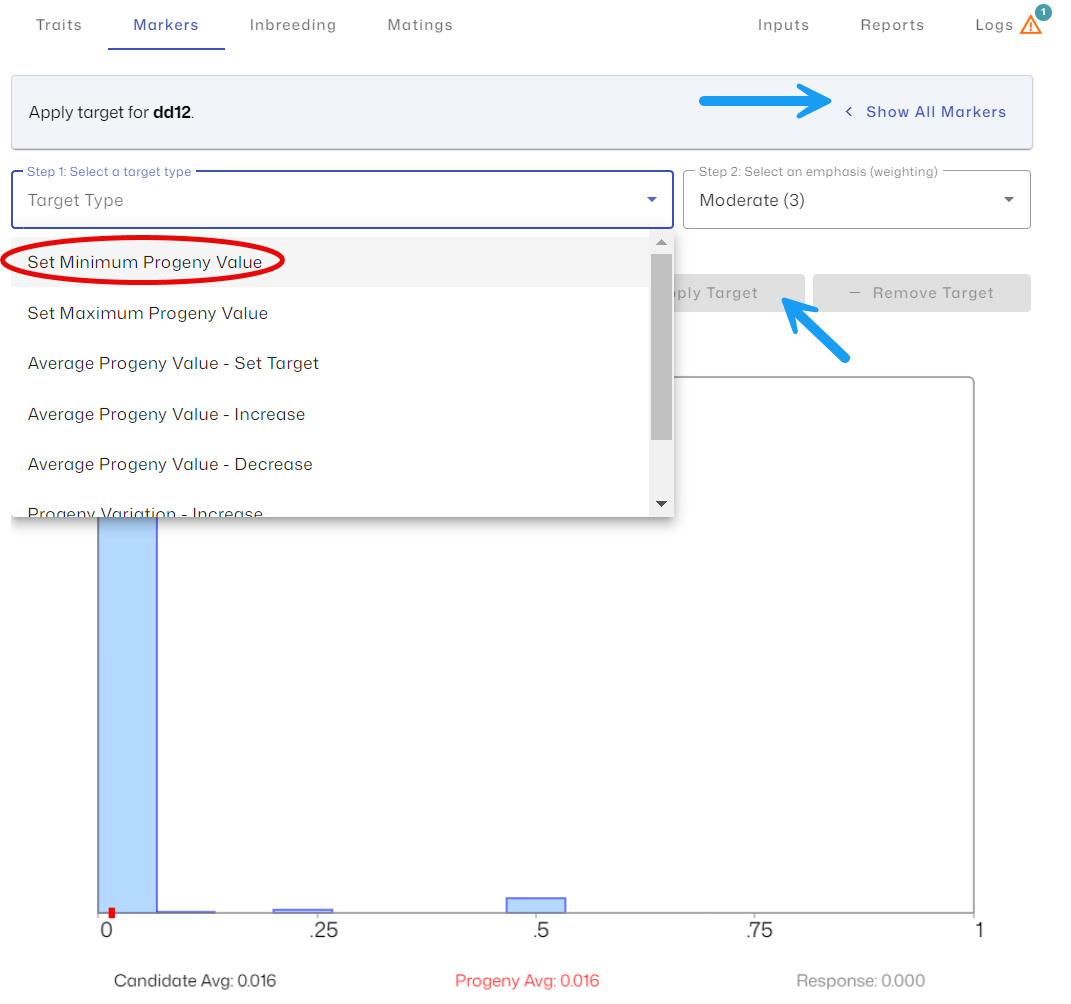
2. Markers – Displays the distribution of the Genetic conditions of the resulting progeny. For:
- Free progeny, displayed as 11
- Carrier progeny, from dam, displayed as 12
- Carrier progeny, from sire, displayed as 21
- Affected progeny, displayed as 22
The black marker indicates the progeny mean based on random mating, the red marker indicates the shift as a result of MateSel optimised mating selection.
Adding additional marker, or genetic condition constraints:
To add an additional target to one of the markers (genetic conditions), select the corresponding histogram. Then choose the Target Type (e.g. minimum, maximum or average progeny values) and the emphasis (weighting). To apply the new target, select “Apply target”.
To return to the view with all markers or genetic conditions, select “Show all markers”.
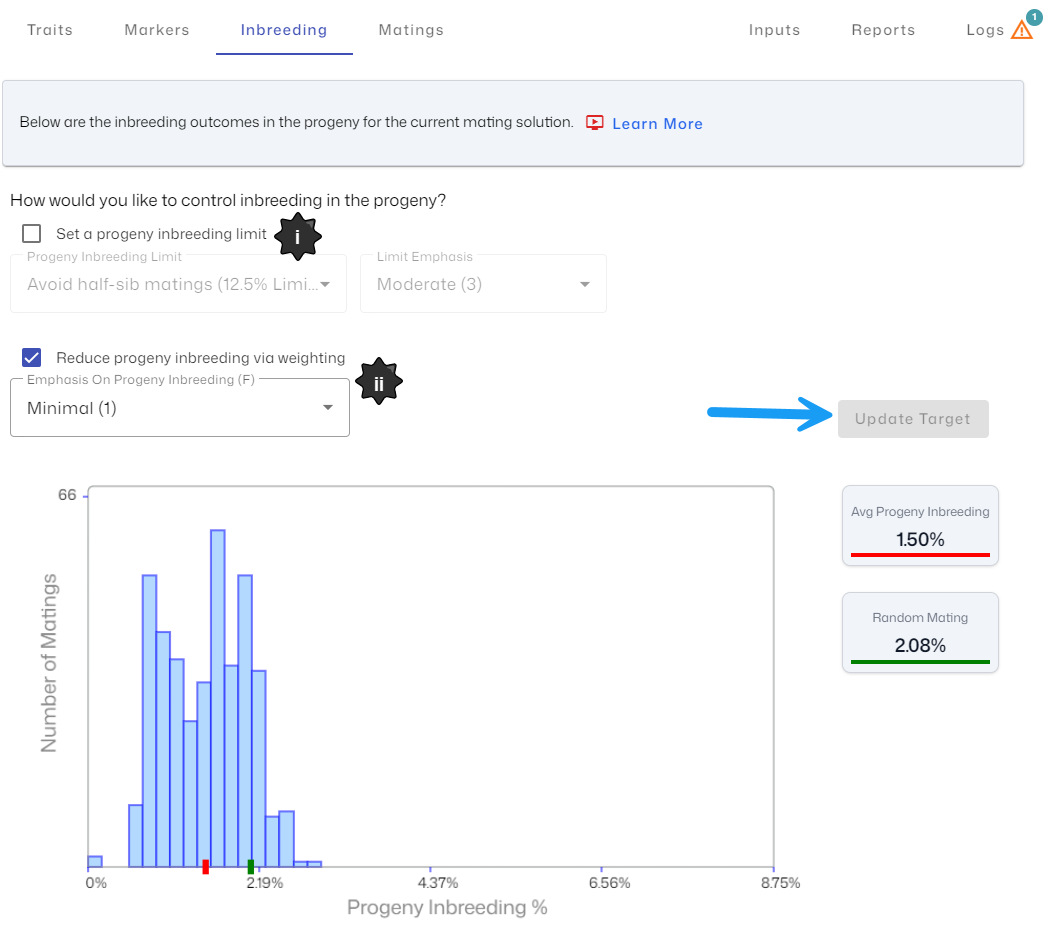
3. Inbreeding – Displays the distribution of the inbreeding coefficients of the resulting progeny.
The green marker indicates the progeny mean based on random mating, the red marker indicates the shift as a result of MateSel optimised mating selection.
Adding additional inbreeding constraints:
There are 2 methods for controlling inbreeding in the progeny:
i. Set a progeny inbreeding limit: Either enter into field or manually select on the histogram. Then add the emphasis level.
ii. Reduce progeny inbreeding via a weighting: Place additional emphasis on the reduced of progeny inbreeding. Select your emphasis level.
Once you have determined your new refined target, select “Update Target”.
4. Matings – Provides:
- Mating List – Provides a list of the optimised matings, with males, females, the estimated resulting progeny’s selection index and inbreeding coefficient (Note. These estimates are the expected mean of progeny and do not guarantee the Selection index result of the resulting progeny).
- Dashboards – Provides simple dashboard reports e.g. sire use summary
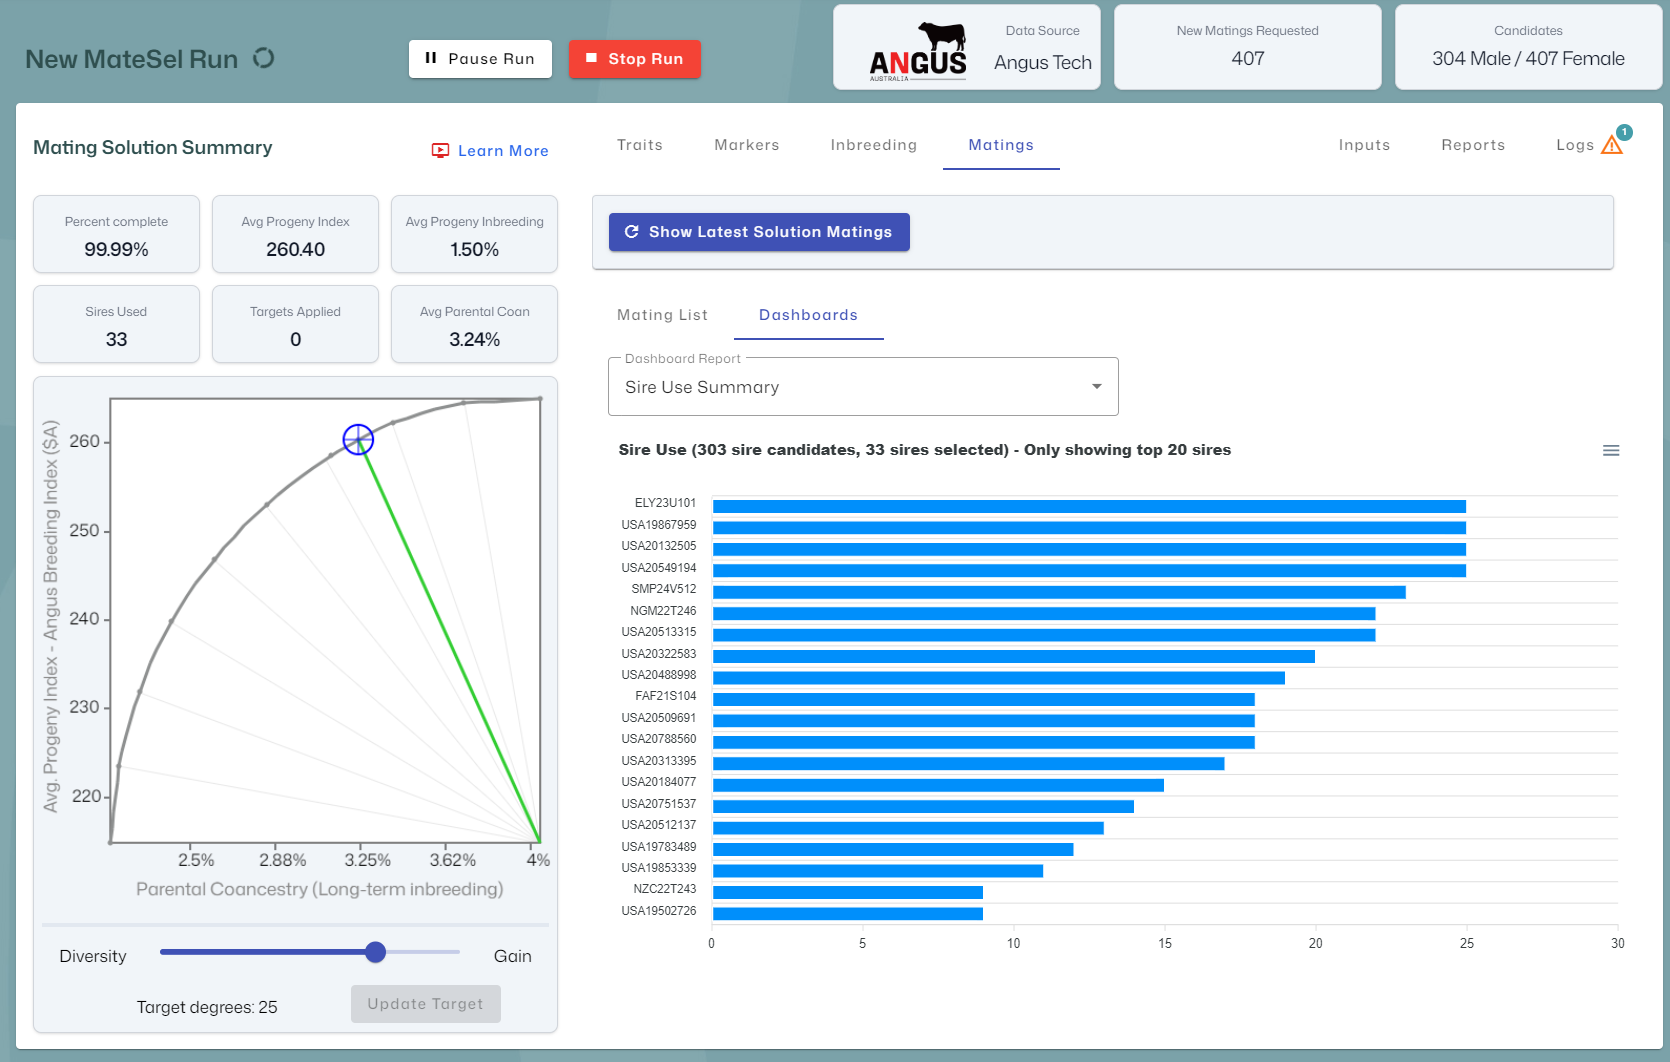
5. Target Degrees – This slider bar allows you to manage your optimisation towards genetic gain or genetic diversity. Once you have determined your new optimum balance select “Update Target” to rerun the MateSel analysis with this updated target.
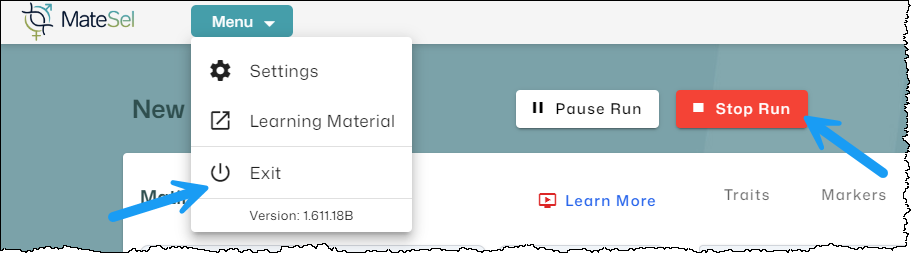
Exit MateSel & Complete Run
Once you are happy with your matings, hit stop run, and then close the MateSel window by clicking on “Menu” and the “Exit”.
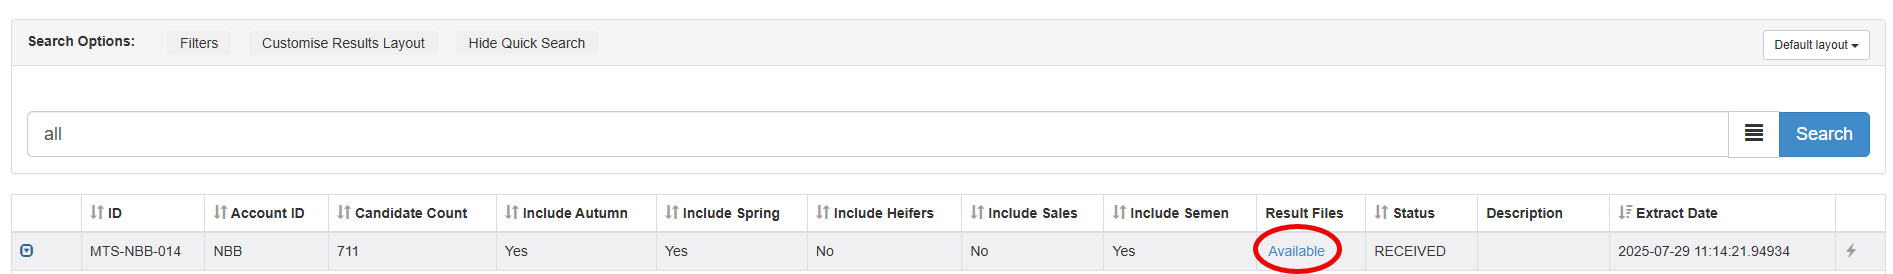
Accessing your mating results
Once the analysis is run, MateSel provides a suggested mating list that balances your targets with inbreeding management and shows your expected herd progress. These are located in the Matings tab of the result dashboard and additionally will be available in Angus.Tech once you have stopped the run or it is completed.
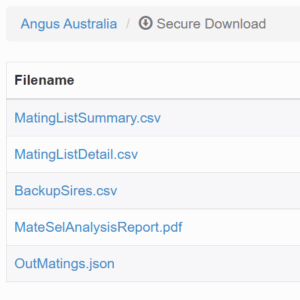
Result Files – Provides downloadable csv and pdf reports.
- Mating List Summary (csv)
- Mating List Detail (csv)
- Backup Sires (csv)
- MateSel Analysis Report (PDF)
The result files are available via in Angus.Tech by clicking on the “Available” link in the ‘Results Files’ column.